A - ISO 8253-2:1992
|
|
||
|
Ears
not covered
|
||
|
|
||
|
comparison of the values from ISO 8253-2:1992 and ANSI S3.1-1991/1999 |
||
|
Table X - |
the differences between ANSI Standards, issued in 1999 and 1991. |
|
|
Table Y - |
the differences between ISO 8253-2:1992 and ANSI S3.1-1991 corrected |
|
|
for binaural listening |
||
|
Table
Z -
|
the differences between ISO 8253-2:1992 and ANSI S3.1-1999 | |
|
Note:
|
There are 3 columns in the ANSI S3.1-1991/1999 standard (125-8000, 250-8000 and | |
| 500-8000 Hz). But ISO 8253-2 standard does not deal with the third one (500-8000 Hz). | ||
| Therefore the next tables contain just columns for test frequency ranges 125-8000 Hz and | ||
| 250-8000 Hz. | ||
|
|
||
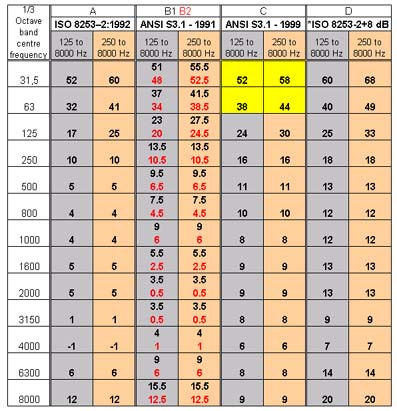
| This table shows the maximum permissible ambient sound pressure levels in one-third octave bands from ISO 8253-2:1992 and ANSI S3.1 - 1991/1999 standards. | ||
 |
||
|
A - ISO 8253-2:1992 |
||
| B1 - ANSI S3.1-1991 | ||
| B2 - ANSI S3.1-1991 -3dB | ||
| C - ANSI S3.1-1999 | ||
| click on the table for bigger picture | up | |
| * Note: This correction (+8dB) can be used in the case that maximum uncertainty of +5 dB due to ambient noise is permitted. | ||
| B2 - red numbers - the ANSI standard from 1991 was prepared for monaural listening. The correction for binaural listening is -3 dB. [TOM FRANK, JOHN D. DURRANT, JEAN M. LOVRINIC, Maximum permissible ambient noise levels for audiometric test rooms. http://journals.asha.org/1059-0089/v2n1/033.pdf] | ||
| The values in yellow field are only calculations. I couldn't check or compare them with the values from ANSI S3.1-1999. | ||
| up | ||
|
|
||
| Table X shows the differences between ANSI Standards, issued in 1999 and 1991. | ||
|
A - ISO 8253-2:1992 |
||
| B1 - ANSI S3.1-1991 | ||
| B2 - ANSI S3.1-1991 -3dB | ||
| C - ANSI S3.1-1999 | ||
| X1 - differences between C and B1; X1=C-B1 | ||
| X2 - differences between C and B2; X2=C-B2 | ||
| Blue numbers - the values from new ANSI standard are lower than in old one. | ||
| Red numbers - the new value at 8kHz is lower even if the old one is corrected for binaural listening (-3dB) | ||
| click on the table for bigger picture | ||
| The values in yellow field are only calculations. I couldn't check or compare them with the values from ANSI S3.1-1999. | ||
| up | ||
|
|
||
|
|
|
| Table Y shows the differences between ISO 8253-2:1992 and ANSI S3.1-1991 corrected for binaural listening. | |
| This table is for information. | |
 |
|
|
A - ISO 8253-2:1992 |
|
| B1 - ANSI S3.1-1991 | |
| B2 - ANSI S3.1-1991 -3dB | |
| C - ANSI S3.1-1999 | |
| Y - differences between A and B2; Y=A-B2 | |
| Red numbers - the values from ANSI are lower than ISO. | |
| up | |
|
|
|
|
|
|
| Table Z shows the differences between ISO 8253-2:1992 and ANSI S3.1-1999 | |
 |
|
|
A - ISO 8253-2:1992 |
|
| B1 - ANSI S3.1-1991 | |
| B2 - ANSI S3.1-1991 -3dB | |
| C - ANSI S3.1-1999 | |
| Z - differences between A and C; Z=A-C | |
| Blue numbers - the values from the ISO 8253-2 standard are lower than in the ANSI S.3-1999 standard | |
| The values in yellow field are only calculations. I couldn't check or compare them with the values from ANSI S3.1-1999. | |
| up | |
|
|
|